Nanaimo’s August 2019 Real Estate Market

Nanaimo’s August 2019 Real Estate Market stats summarize what’s happening in the real estate market in your area. Monthly Nanaimo real estate market stats that analyze the Vancouver Island real estate market north of the Malahat. These Nanaimo real estate market stats can be useful in establishing trends when applied over a period of time.
Keep in mind that the information does not indicate the actual value of any particular property.
Real Estate Market Adjusting As Buyers Adapt to B-20 Stress Test
Real Estate Market Trend
VIREB’s real estate market has transitioned from favouring sellers to a balanced market and, in some areas, is shifting towards a buyers’ market. Sellers are recognizing that the market has changed and are pricing their homes accordingly.
One selling factor that remains constant is that well-priced homes sell faster.
Prices in the VIREB area are still rising, but the magnitude is softening.
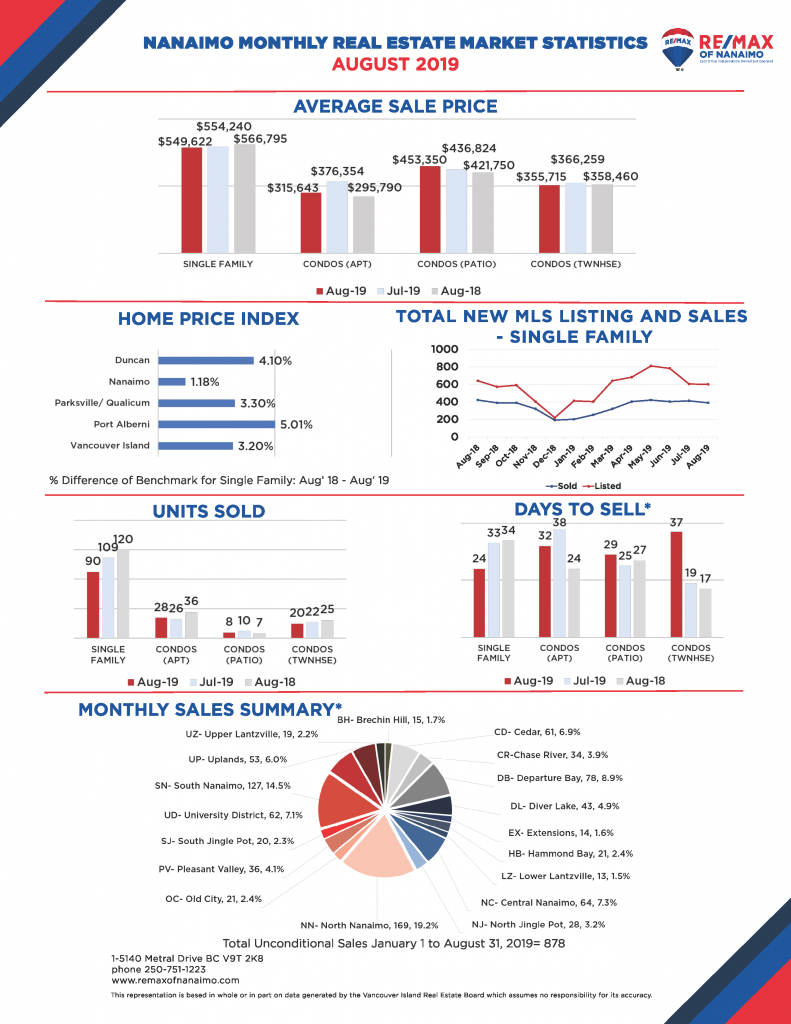
- Nanaimo’s benchmark price rose slightly to $560,200
- Parksville-Qualicum area saw its benchmark price increase by three per cent to $590,000.
- Port Alberni reached $318,200 in August, a five per cent increase from one year ago.
Benchmark Price
- The benchmark price of a single-family home board-wide was $515,400 in August, a three per cent increase from one year ago and up slightly from July.
- In the apartment category, the year- over-year benchmark price also rose by three per cent, climbing to $302,800 and marginally higher than in July. The benchmark price of a townhouse rose by five per cent board-wide, hitting $417,300 last month, which was two per cent higher than July’s benchmark of $410,600.
Real Estate Sales
- Sales of single-family homes in August board-wide dipped by 11 per cent year over year and were nine per cent lower than in July.
- Year-over-year sales of apartments and townhouses dropped by 28 per cent and 25 per cent, respectively.
REALTORS® report that VIREB’s real estate market is adjusting somewhat as buyers adapt to the restrictions imposed by the B-20 stress test and sellers curb the expectations formed during the booming markets of 2016 and 2017.
Real Estate Inventory
- In the VIREB area, inventory of single-family homes in August rose by 11 per cent from one year ago (1,343 to 1,485).
- Active listings of apartments increased by 23 per cent (299 to 369) year over year while townhouse inventory is virtually the same as reported last July (176 to 173).
“Whether you’re a buyer or seller, a REALTOR® can help you cut through the fog of confusion around home prices,” says Broens. “We have access to tools and market analytics that empower us to dig deeply into sales data and comparatives. That information allows us to determine an optimal selling price for your home and help you find a house that fits your needs and budget.”
***
Find out what your home may be worth in today’s market.
CONTACT A REALTOR® | SEARCH FEATURED PROPERTIES | HOMES FOR RENT
If you require specific information on property values please contact one of our REALTORS® or call (250) 751-1223.
Source: vireb.com